Successful realisation of audits
- Interactive Dashboard in the Web Portal for data analysis and cockpit-evaluations in real-time
Web based, interactive surface with individual adaptability
- organise a variety of diagram types fast and simply
- freely configurable
- interactive navigation, selection and filter
- data analysis and real time evaluation - Weak Point Analysis
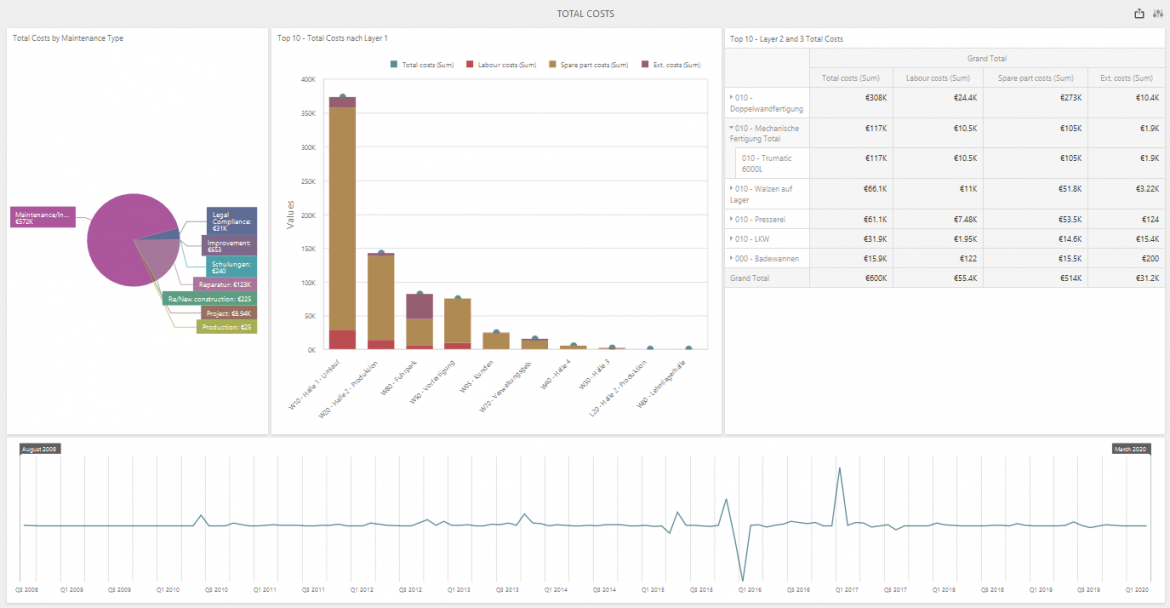
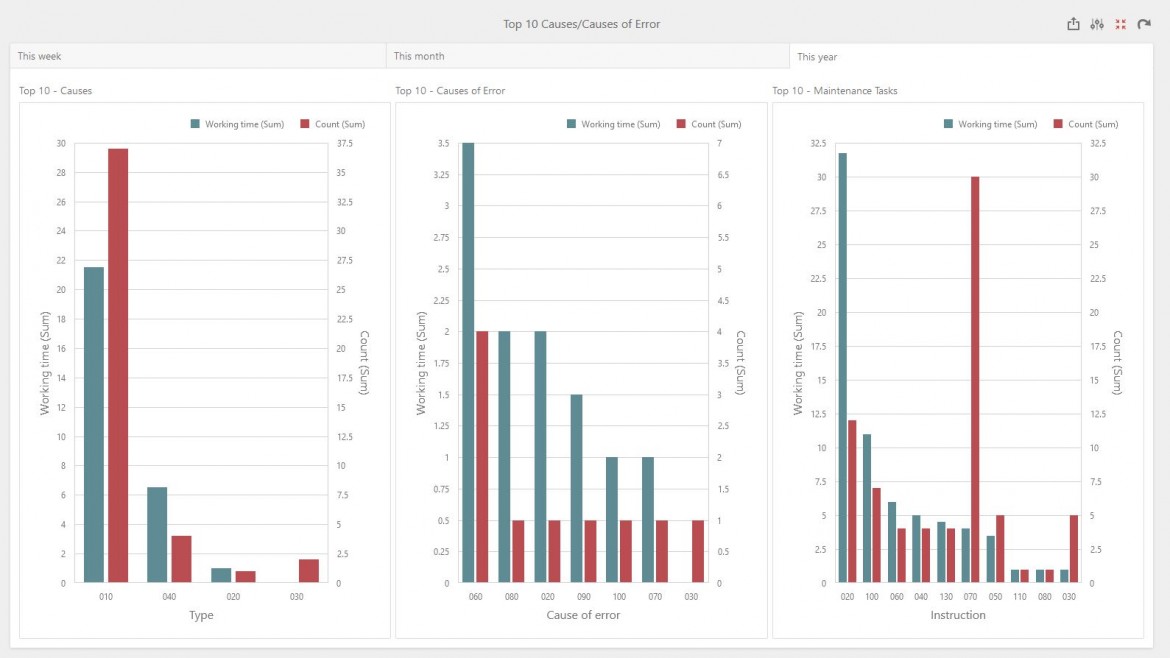
- Top 10 - comparison
- Multiple evaluations relating to plant elements, cost centres, use groups, employees
- Free defineable periods
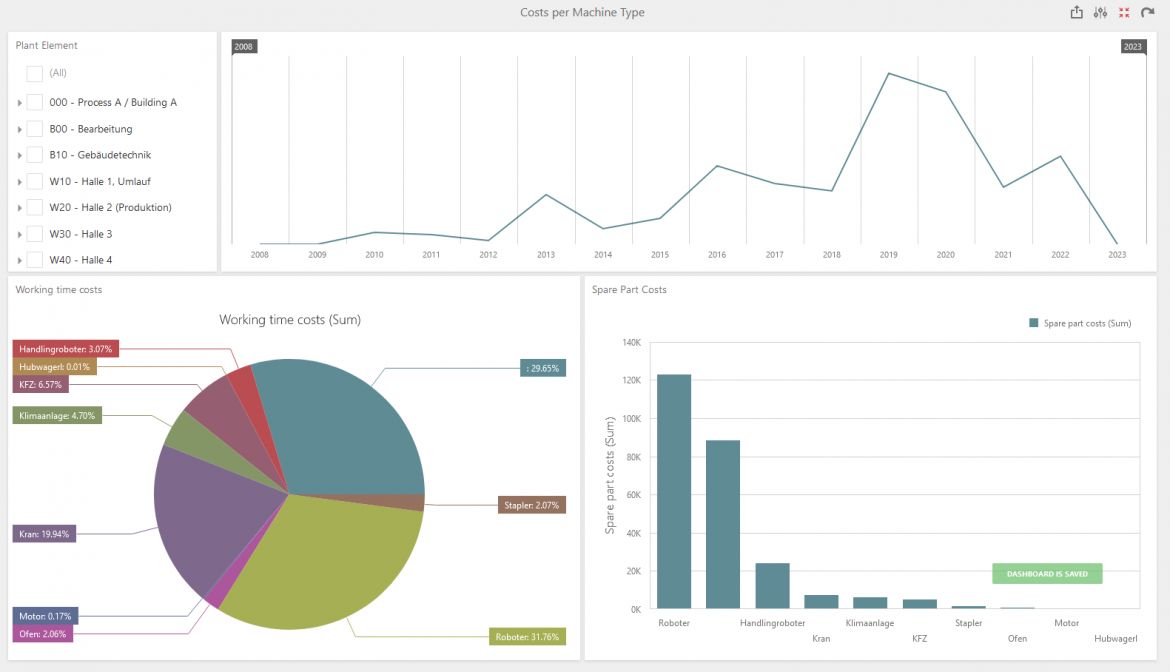
- Extensive graphic displays like 3D line-diagrams, columns, bar- and pie-charts etc.
- Selection of the plant elements directly in the evaluation module
- Evaluation of necessary spare parts
- Diverse Target-Performance Analyses
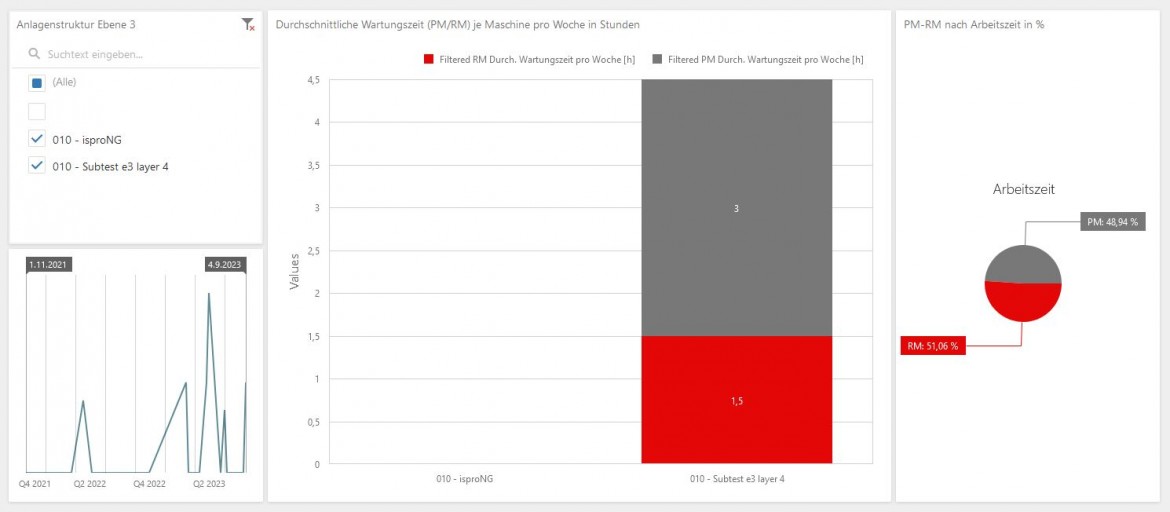
- Evaluation according to maintenance types, optional in combination with employees
- Display in quarterly periods, months or calender weeks
- All evaluations can be printed and exported (e.g. Excel)
- Evaluation of planned down time and planned maintenance times, -costs
- Planning of staff resources with workload diagram
- Maintenance cost quota, spare part-, material- and external costs-quota
- Proportion of staff costs
- Degree of planning - MTBR, MTBF
- Pareto Analyses
- KPI-Module: predefined reports which are sended automatically in fixed time intervals to defined receivers
- Dashboard: visual display of free defineable maintenance data for each plant element and user. Individual configurable display filter (e.g. by employees, use-groups, levels,...)


